Blog

us.jpg   fr.jpg

This has been the sharpest sell-off in history (S&P500 decline since peak)

39.png

Trailing 12 months return differential between U.S. and non-U.S. stocks

35.png

Most asset classes are deeply in the red year-to-date

38.png

International equity reduces the volatility of the portfolio

34.png

Growth of $1 Following 30% Drop in U.S. Total Market

37.png

Historical mix of global equity market capitalization

33.png

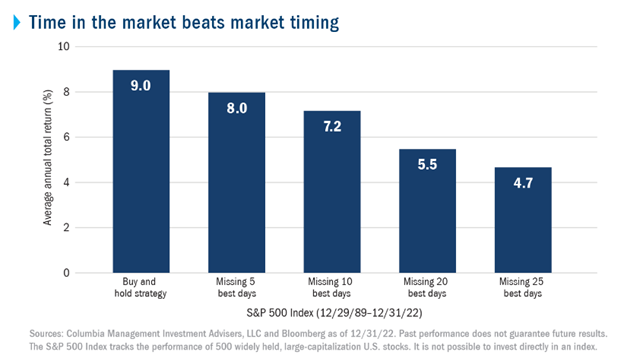
Market-Timing Risk (1970-2019)

36.png

Long-run EM and DM returns, 1900-2018

32.png

U.S. adults whose households have no emergency savings

35.png

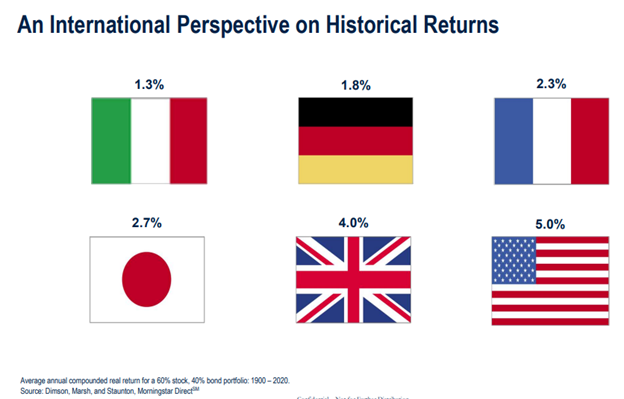
Real equity and bond returns in selected markets

31.png

Syndicate content